Inadequacy of Specific Micronutrient Intake Probability and cut-point method
Overview
The Inadequacy of Specific Micronutrient Intake is an indicator that estimates the percent of a given population that is at risk of inadequate intake for a specific micronutrient. Two methods can be used to assess inadequacy: Estimated Average Requirement (EAR) fixed cut-point method, or the probability method. Both methods require nutrient intake data for a population that has been adjusted to represent the distribution of "usual" nutrient intakes. Micronutrients are of particular nutritional importance because malnutrition due to micronutrient deficiency continues to be a widespread problem in low- and middle-income countries. Micronutrients, such as iron, iodine, vitamin A, and zinc, are essential not just for infants and children to ensure proper growth and development, but are also necessary for adults for continued work productivity, healthy pregnancies, and overall cognitive and physical health (Bailey et al., 2015). It is important to note that the EAR fixed cut-point method cannot be used for iron in the case of menstruating women and young children due to a highly skewed requirement distribution as a result of increased iron needs. The other indicators that interpret individual dietary intake data in the Data4Diets platform include Mean Adequacy Ratio (MAR), total individual micronutrient intake, total individual macronutrient intake, and total individual energy intake.
Method of Construction
Both methods of calculating this indicator require nutrient intake data for a population that has been adjusted to represent the distribution of "usual" nutrient intakes. The data used to estimate this distribution are collected using quantitative dietary assessment techniques, such as repeated 24-hour dietary recalls or multiple-day weighed food records, which are then translated into nutrient intakes using national or regional Food Composition Tables. To provide accurate estimates of the percent of a population at risk of inadequate intake, repeated intakes (either 24-hour Dietary Recall or Weighed Food Records) are required on at least a sub-sample of the population, in order to account for day-to-day variation.
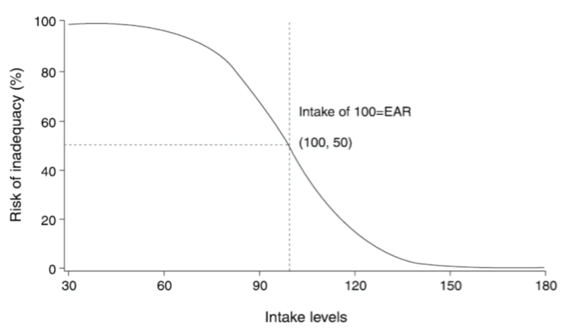
The EAR fixed cut-point approach plots the EAR value onto the distribution of "usual" nutrient intakes to establish a cut-point, and calculates the percent of intakes that fall below that point to estimate the percent of the population at risk of inadequate intakes. The EAR for a nutrient is its estimated average requirement for a population (i.e. 50% of the population will have a requirement >EAR and 50% will have a requirement <EAR in relation to their usual nutrient intakes). See Figure 1 below for a visual representation of this method:
Figure 1

Source: Institute of Medicine, (2000). "Dietary Reference Intakes: Applications in DietaryAssessment."
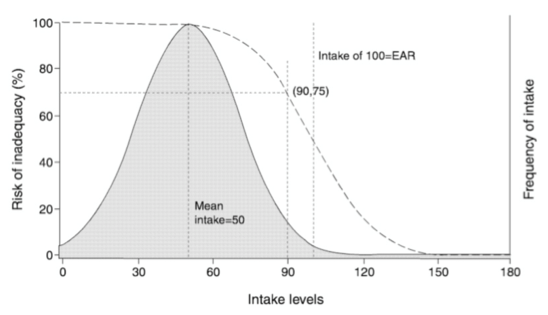
The probability approach uses intake data from the study population to construct a distribution of intakes for that population, and uses this distribution of intakes along with the distribution of "usual" requirements to estimate the percent at risk of inadequate intakes in the population. See Figure 2 below for a visual representation of this method:
Figure 2

Source: Institute of Medicine, (2000). "Dietary Reference Intakes: Applications in DietaryAssessment."
The probability of inadequacy can be manually calculated as a weighted average of the risk of inadequacy at each potential level of intake. To perform this calculation, the requirement distribution is divided into categories based on gender and age, and the number of people from the population with nutrient intakes falling into each category is determined and multiplied by the probability of inadequacy for that category. These values are summed across all categories and then divided by the total population and multiplied by 100 to estimate the percent at risk of inadequate intake in the population.
For an explanation of situations in which the EAR fixed cut-point method can be used, refer to Box 4-2 in theDietary Reference Intakes (DRI) document (Institute of Medicine [IOM], 2000). For a list of nutrients for which the probability approach can be used, refer to Table 4-1 in the same document (IOM, 2000).
For more detail on using both the probability and cut-point methods for estimating inadequacy, refer to Chapter 4 of the DRI document (IOM, 2000). To read about DRIs and their appropriate uses, refer to the following paper published in Public Health Nutrition (Murphy & Poos, 2002).
Uses
This indicator is used to estimate the percent of a given population that is at risk of inadequate intakes of individual nutrients, so it can be used to identify the need for nutrient-specific interventions such as fortification or supplementation.
Strengths and Weaknesses
The main strength of this method is that it provides an estimate of the percent of a population that is at risk of inadequate intake of specific nutrients. Although this indicator does not provide a measure of overall dietary adequacy in a single index, it does provide a measure of overall dietary adequacy when the percent at risk of inadequate intakes is calculated for multiple nutrients separately. A weakness, however, is that this indicator requires an EAR, which is unknown for certain nutrients, and is unknown for most nutrients during infancy. In addition, the DRIs for many nutrients, such as iron and zinc, vary depending on the assumed absorption, which can differ depending on the type of food consumed. Therefore, this indicator (and any others that rely on nutrient requirements) can only estimate the risk of inadequate nutrient intake, rather than confirming deficiency. Although this indicator uses individual-level dietary data, it can only be used to estimate risk of inadequate intake at the population level, and cannot be used to identify individuals who are deficient or at risk of inadequacy (Yates et al., 1998).
Data Source
The data used to estimate the "usual" distribution of intakes for a nutrient are collected using quantitative dietary assessment techniques, such as repeated 24-hour Dietary Recalls, multiple- day Weighed Food Records, or quantitative Food Frequency Questionnaires, which are then translated into nutrient intakes using national or regional Food Composition Tables. As noted above, repeated intakes are required on at least a sub-sample of the population.
The Food and Agriculture Organization/World Health Organization Global Individual Food consumption data Tool (FAO/WHO GIFT) is one source of individual-level quantitative dietary data. The FAO/WHO GIFT aims to make publicly available existing quantitative individual food consumption data from countries all over the world. Food Composition Tables can be found at FAO's International Network of Food Data Systems (INFOODS) or the World Nutrient Databases for Dietary Studies (WNDDS), developed by the Agricultural and Food Systems Initiative, now known as the Agriculture and Food Systems Institute. EARs can be obtained from the Institute of Medicine (IOM, 2006), or other country-specific national sources.
Links to Guidelines
- National Academies of Sciences, Engeneering and Medicine (1986). Nutrient Adequacy.
- Institute of Medicine (2006). Dietary Reference Intakes: The essential guide to nutrient requirements."
- Institute of Medicine (2000). Dietary Reference Intakes: Applications in dietary assessment.
- Lindsay et al. (2020). Perspective: Proposed Harmonized Nutrient Reference Values for Populations.
Links to Validation Studies
Links to Illustrative Analyses
- Bermudez et al., (2012). "Estimating micronutrient intakes from household consumption and expenditure surveys (HCES): An example from Bangladesh."
- Barbosa et al., (2014). "A study of the prevalence of adequacy of iron and vitamin c in children’s diets."
- Mekonnen et al. (2021). Food consumption patterns, nutrient adequacy, and the food systems in Nigeria. Agricultural Economics.
- Shalini et al. (2019). Micronutrient intakes and status assessed by probability approach among the urban adult population of Hyderabad city in South India. European Journal of Nutrition.
- Sovianne ter Borg et al. (2015). Micronutrient intakes and potential inadequacies of community-dwelling older adults: a systematic review. British Journal of Nutrition.
- Beal et al. (2017). Global trends in dietary micronutrient supplies and estimated prevalence of inadequate intakes. PloS one.
